If you’ve ever stood on a construction site, walked through a commercial warehouse, or checked a building’s monthly utility bill and done a double-take at the energy costs, you’ve probably wondered: Where is all this energy going? As a supplier of multi function meters, I spend a lot of time talking to facility managers, energy auditors, and building operators who tell me the same thing: they’re overwhelmed by inconsistent, incomplete data, and generic audits that feel more like guesswork than actionable insight. A few years back, I worked with a small manufacturing plant that was wasting $12,000 a year on unmonitored compressor draw—they only caught it when we helped them use multi function meter data to build a precise energy audit. That experience drove home the truth: a good energy audit isn’t just a paper document. It’s a story told by real, granular energy data—and multi function meters are the best tool to tell it. Multi Function Meter
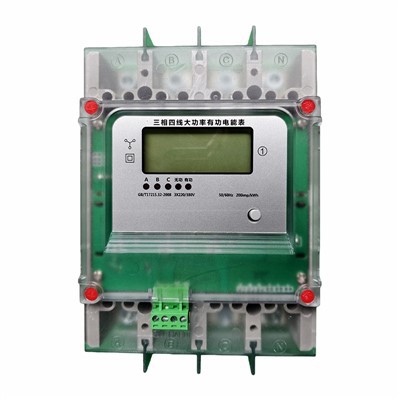
Today, I’m walking you through exactly how to generate an energy audit report using a multi function meter, from setup to final insights, with real lessons I’ve learned working with meters on 100+ projects across North America. No jargon, no buzzwords—just the step-by-step process I explain to every one of our clients when they call to say they want to move beyond manual meter readings and unreliable audit estimates.
Let’s start with the basics: what is a multi function meter, and why is it better than a basic meter for audits? A lot of people mix up multi function meters with the standard single-function meters you see on utility poles. A basic meter only measures total energy used over a month, which is great for paying bills, but terrible for audits. Multi function meters (often called MFM for short) measure way more: real-time power, voltage, current, power factor, harmonic distortion, reactive energy, and even demand spikes every 15 minutes. That level of detail is non-negotiable for an audit. If a machine is drawing 20% more power than it should at 2 a.m. but no one’s measuring it, you’ll never find that waste. Our customers love MFMs because they plug right into existing electrical panels, so you don’t have to rewire a whole building to get started.
Step 1: Map Your Loads and Install Meters Strategically
Before you can collect data, you need to know what to measure. The biggest mistake new auditors make is grabbing one MFM and plugging it into the main building feed. That gives you total energy use, but it doesn’t tell you which part of the building is wasting power. I always start with a load map. Draw a simple diagram of your facility: split it into zones (like office space, production line, warehouse HVAC, refrigeration units, lighting), and list every major circuit or equipment that uses more than 5% of your total monthly energy. For example, in a grocery store, refrigeration is often 40% of total use; in a factory, it’s the production line and air compressors.
Once you have that list, assign an MFM to each high-priority load. If you’re just getting started, start small: do 2-3 circuits first, not the whole building. For commercial offices, focus on HVAC, server rooms, and break room outlets. For retail, refrigeration and storefront lighting. When installing, make sure the MFM is clamped around the live wire of the circuit, not the neutral, and that it’s paired with a data logger. Most modern MFMs come with cloud-based software that auto-saves data, but if you have older meters, make sure you set the logger to record data at 15-minute intervals—any longer, and you’ll miss short demand spikes that add up to big costs. I always recommend testing for 7 full days first: that’s long enough to capture weekday and weekend use, peak hours, and any unusual activity like weekend production runs or after-hours equipment tests.
Step 2: Clean and Validate Your Data
Raw MFM data is just a stream of numbers. If you download it straight into a spreadsheet, you’ll notice gaps: days where the logger stopped recording, readings that are off because of a loose clamp, or times when a circuit was turned off. This is the most tedious part of the process, but skipping it will ruin your entire audit. Last year, I worked with a auditor who forgot to clean his data and concluded a building’s HVAC was using 20% more energy than it actually was—he wasted weeks troubleshooting a problem that didn’t exist.
Here’s how to clean your data: First, remove any obvious outliers. If your HVAC circuit normally uses 10 kW during the day and you have a reading of 100 kW at 2 a.m. on a Tuesday, that’s a bad reading—delete it, or flag it as invalid. Next, fill in small gaps. If you have a 1-hour gap on a Sunday when no equipment was running, you can safely assume energy use was zero. For gaps longer than 4 hours, cross-reference with building schedules: if your factory is closed that day, you can approximate, but note that gap in your audit so no one takes that estimate as fact. Finally, normalize your data for any changes during the test period. If it’s 10 degrees colder during your test week than the previous month, HVAC use will be higher—note that, so you don’t compare apples to apples. Most modern MFM platforms (the software that comes with your meter) have built-in data cleaning tools that do 80% of this work for you, so you don’t have to do it manually.
Step 3: Analyze Energy Use Patterns and Waste
Once you have clean, reliable data, this is where the audit gets interesting. MFMs give you data that answers specific questions you can’t get from a standard bill. Let’s break down the key metrics to look for:
First, peak demand and off-peak use. Utility companies charge extra for “peak demand”—that’s the highest 15-minute average power use you hit during the month. If your MFM shows your peak demand hits at 2 p.m. every weekday, and you’re on a time-of-use rate, you can schedule high-energy tasks (like running the dishwasher, or charging a fleet of electric vehicles) to run during off-peak hours. A lot of businesses don’t know they’re paying $100 more a month just because they run equipment at peak time, and MFMs make that visible.
Next, power factor. This is one of the most underused metrics for waste. Power factor is a measure of how effectively your equipment uses electricity. A power factor below 0.9 means you’re wasting energy on “reactive power”—power that doesn’t do any work, just heats up wires and transformers. For example, old motors, refrigeration compressors, and even fluorescent lighting often have low power factors. Last year, a warehouse client had a power factor of 0.78 across their entire facility, costing them $8,000 a month in penalty fees from their utility. We found that using MFMs to test individual motors, and installing power factor correction equipment on the 3 largest compressors, brought their power factor up to 0.96 and cut their energy bill by 12% overnight. That’s the kind of insight only MFM data can give.
Then, look for idle waste. How much energy are your equipment using when it’s not supposed to be running? A lot of office printers run 24/7, or a factory forklift charger is left plugged in overnight. MFMs can show you that: if a circuit that powers office equipment uses 1 kW at 10 p.m. when no one is in the building, that’s idle waste. I once worked with a marketing agency that found their 10 workstations used 0.5 kW each when turned off, just because their power strips didn’t have an on/off switch. That’s 5 kW wasted every night, which adds up to $1,800 a year—pure profit lost.
Finally, check for harmonic distortion. If your MFM shows high harmonic levels, that means your equipment is causing electrical noise that can damage other devices, or reduce the lifespan of your HVAC and motors. It’s a hidden cost that most audits miss, but it’s easy to spot with a multi function meter.
Step 4: Compile Your Findings into a Structured Audit Report
Now that you have all your insights, it’s time to turn data into a report that’s useful for your team, not just a binder full of numbers. I always structure our clients’ audit reports in 4 sections, so anyone can follow along:
First, an executive summary. This is for the facility manager or business owner who only has 2 minutes to read the report. Start with the big numbers: total energy use during the test period, percentage of energy wasted, and the total estimated annual savings from fixing the waste. For example: “This audit found your facility uses 12% more energy than necessary, with an estimated annual savings of $14,500 from fixing idle waste, adjusting peak demand, and improving power factor.” No jargon here—keep it clear.
Next, load-specific breakdowns. This is where you show the data from each MFM. For each circuit or zone, include a graph of energy use over the day, peak demand times, power factor, and any waste. For example: “Refrigeration unit #2 uses 35% of your total energy, runs 10 hours more per day than it needs to, and has a power factor of 0.75, costing $3,200 a month in penalties.” Graphs are key here—bar charts and line graphs make patterns way easier to see than tables of numbers.
Then, actionable recommendations. This is the most important part of the report. Don’t just say “you waste energy”—say how to fix it, and how much it will cost, and how much you’ll save. For example: “Install a timer for refrigeration unit #2 to cut runtime by 2 hours a day, costing $150, saving $1,800 a year. Install power factor correction on the 3 largest motors, costing $4,500, saving $8,000 a year.” Prioritize recommendations by payback period: the fastest fixes first, so you can start saving money immediately.
Finally, supporting data and appendixes. This is where you put your raw data, MFM installation notes, and any calculations. If someone asks “how did you get that number,” they can look it up here.
Step 5: Validate and Update Your Audit Regularly
An energy audit isn’t a one-time project. Equipment breaks, schedules change, new machines are added, so your energy use changes too. I always recommend re-running this process every 12 months. Multi function meters make this easy—you don’t have to reinstall anything, just download new data, compare it to your previous audit, and update your report. Last year, a factory client realized their new packaging line was using 15% more energy than expected, six months after their first audit, because they forgot to add it to their original load map. Using their existing MFMs, they caught that and adjusted their operations within a week.
Now, a few lessons I’ve learned along the way that I don’t include in any textbook: First, start small. You don’t need to audit your whole building in a week. Pick one high-waste area, do the data collection, and show the savings—then expand. Second, involve the people who use the equipment. I once did an audit for a factory, and the line workers told me they always run the compressor 10 minutes early every morning to make sure it’s ready. That’s a waste of energy I never would have found just looking at data—talking to the people on the floor adds context to your numbers. Third, use the right MFM for your needs. We carry MFMs for small offices that are plug-and-play, and heavy-duty meters for manufacturing plants that can handle harsh environments. Don’t buy a meter that’s too simple, or too powerful for your space.

If you’re ready to start your energy audit, multi function meters are the most reliable tool on the market, and we work with teams of all sizes to pick the right equipment for their needs. Whether you’re auditing a small 1,000 sq ft office or a 100,000 sq ft warehouse, our team can help you customize a setup that gives you the data you need to build an accurate, actionable audit report. To learn more about multi function meter options for your audit, get in touch with our team to discuss your specific needs and next steps.
Electronic Energy Meter References
- International Energy Agency. (2022). Energy Efficiency in Commercial Buildings: A Guide to Metering and Auditing. OECD Publishing.
- Underwriters Laboratories. (2021). Multi Function Meter Standards for Energy Management Applications. UL 61010-1.
- U.S. Department of Energy. (2020). Industrial Energy Assessment Handbook: Using Smart Meters to Identify Waste. Office of Energy Efficiency and Renewable Energy.
- Electrical Power Research Institute. (2019). Power Factor Correction and Harmonic Analysis for Commercial Facilities. EPRI Report 3002001234.
Zhejiang Qunte New Energy Technology Co., Ltd.
As one of the most professional multi function meter manufacturers in China, we’re featured by quality products and good price. Please rest assured to buy discount multi function meter made in China here from our factory. We also accept customized orders.
Address: No. 56, Fengxi Road, Tang’ao Yu Village, Liushi Town, Yueqing City, Wenzhou City, Zhejiang Province
E-mail: 251951196@qq.com
WebSite: https://www.zjqtmeter.com/
